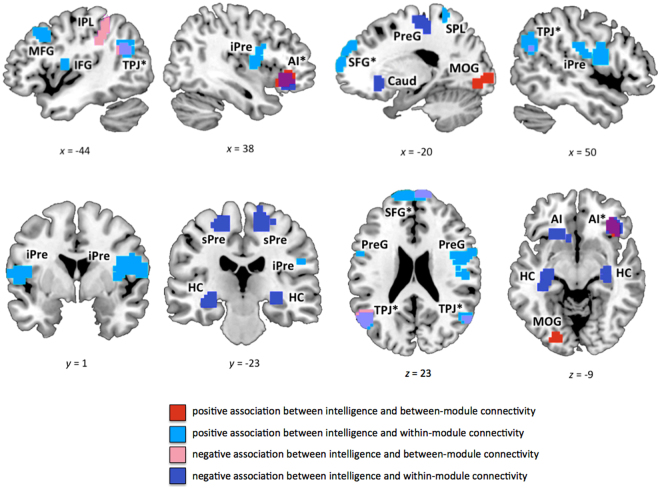
Figure 3.
Clusters of nodes where intelligence was significantly associated with between-module or within-module connectivity (see also Table 2A,B). Between-module connectivity was operationalised by participation coefficient p i, within-module connectivity by within-module degree z i (see Methods for more details). Graph metrics (p i and z i) were calculated for binarised and proportionally thresholded graphs using five different cut-offs (i.e., graphs were defined by the 10%, 15%, 20%, 25%, or 30% strongest edges). For each participant, individual mean maps for the graph metrics were calculated by averaging across these five thresholds. Statistic parametric maps for both measures are shown at a voxel-level threshold of p < 0.005, uncorrected, combined with a cluster-level threshold of k > 26 voxels, corresponding to an overall threshold of p < 0.05, family-wise corrected for multiple comparisons (see Methods). Clusters with effects in both measures are marked with an asterisk (see also Fig. 4). SFG, superior frontal gyrus; AI, anterior insula; MFG, middle frontal gyrus; IFG, inferior frontal gyrus; SMA, supplementary motor area; Caud, caudate nucleus; HC, Hippocampus; iPre, inferior precentral gyrus; sPre, superior precentral gyrus; STG, superior temporal gyrus; TPJ, temporo-parietal junction; SPL, superior parietal lobule; IPL, inferior parietal lobule; MOG, middle occipital gyrus. The x-, y-, and z-coordinates represent coordinates of the Montreal Neurological Institute template brain (MNI152).

