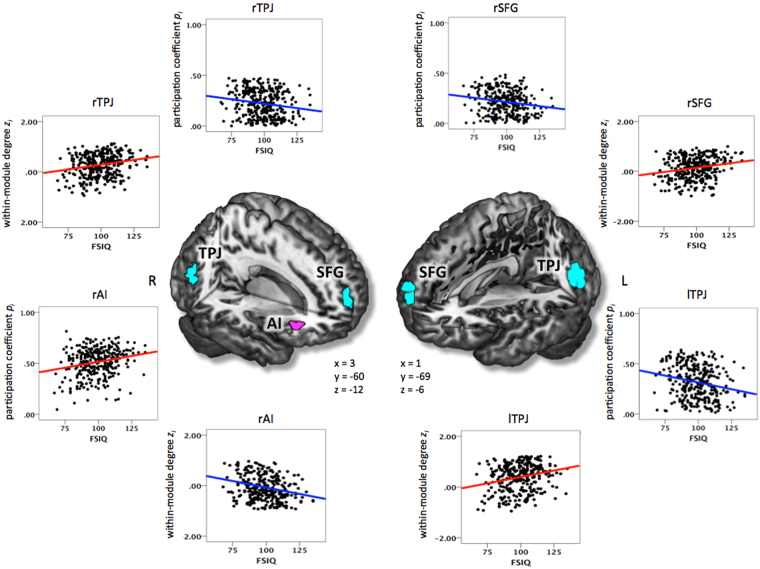
Figure 4.
Clusters of nodes where intelligence was significantly associated with both modularity-defining dimensions (i.e., between-module and within-module connectivity; see also Table 2C). Between-module connectivity was operationalised by participation coefficient p i, within-module connectivity by within-module degree z i. Graph metrics (p i and z i) were calculated for binarised and proportionally thresholded graphs using five different cut-offs (i.e., graphs were defined by the 10%, 15%, 20%, 25%, or 30% strongest edges). For each participant, individual mean maps for the graph metrics were calculated by averaging across the five thresholds. Statistic parametric maps for the conjunction between both measures are shown at a voxel-level threshold of p < 0.005, uncorrected, combined with a cluster-level threshold of k > 26 voxels, corresponding to an overall threshold of p < 0.05, corrected for multiple comparisons (see Methods). The scatterplots illustrate the associations between intelligence (i.e., WASI Full Scale Intelligence Quotient; FSIQ) and participation coefficient p i as well as between intelligence and within-module degree z i for the right superior frontal gyrus (rSFG), the right anterior insula (rAI), the left temporo-parietal junction area (lTPJ), and the right temporo-parietal junction (rTPJ). The x-, y- and z-coordinates represent coordinates of the Montreal Neurological Institute template brain (MNI152) and refer to the points of origin at which the slices were partially cut out. L, left; R, right.

