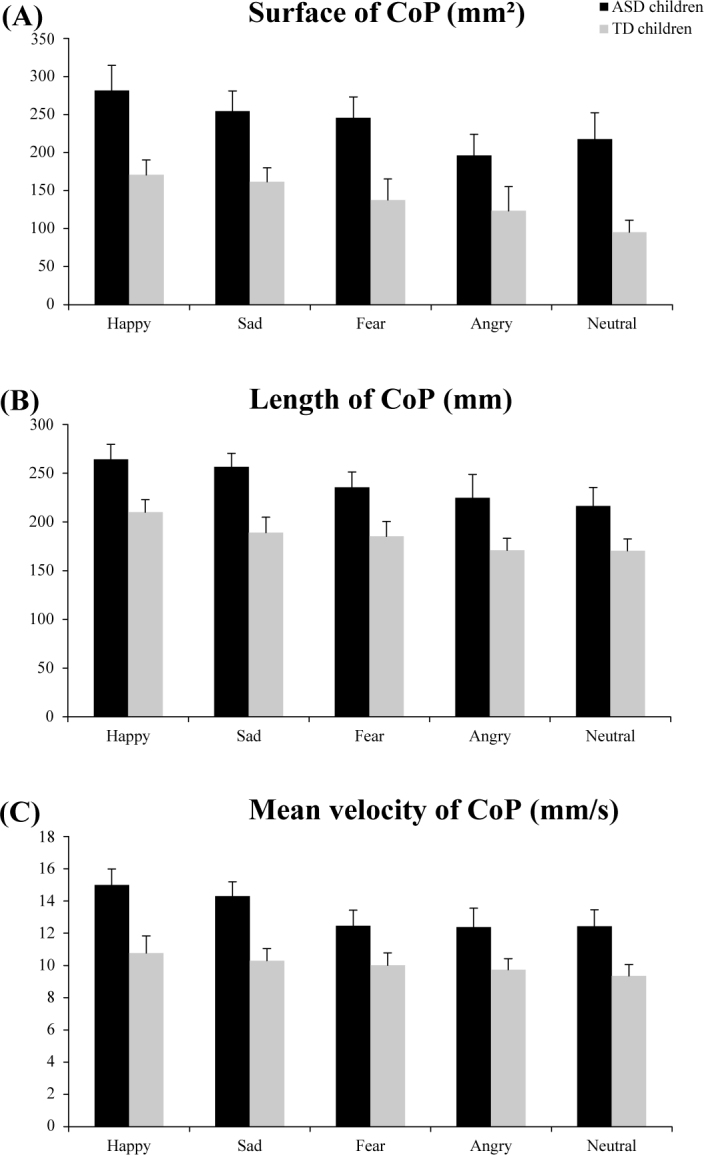
Figure 2.

Surface area (mm2) (A), length (mm) (B) and mean velocity (mm/s) (C) values of the CoP for both ASD and TD for the five emotional faces (happy, sad, fear, angry, and neutral) during postural recordings. Vertical bars indicate standard error.
