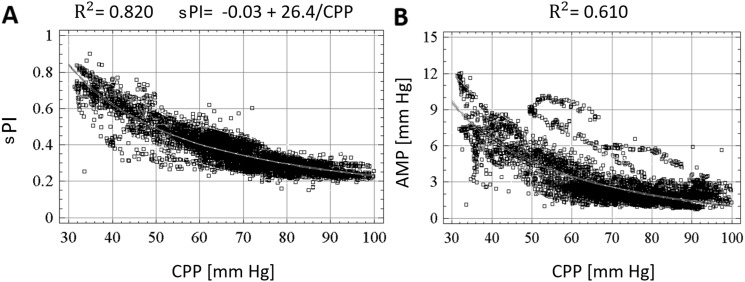
Fig. 2.
Nonlinear regression analysis of CPP versus sPI (F1/FV) and CPP versus AMP in plateau cohort. a Nonlinear regression of CPP versus sPI. b Nonlinear regression of CPP versus AMP. AMP ICP pulse amplitude, CPP cerebral perfusion pressure, F1 amplitude of fundamental frequency of FV, FV mean blood flow velocity in the mean cerebral artery (MCA), mm Hg millimeter of mercury, sPI spectral pulsatility index

