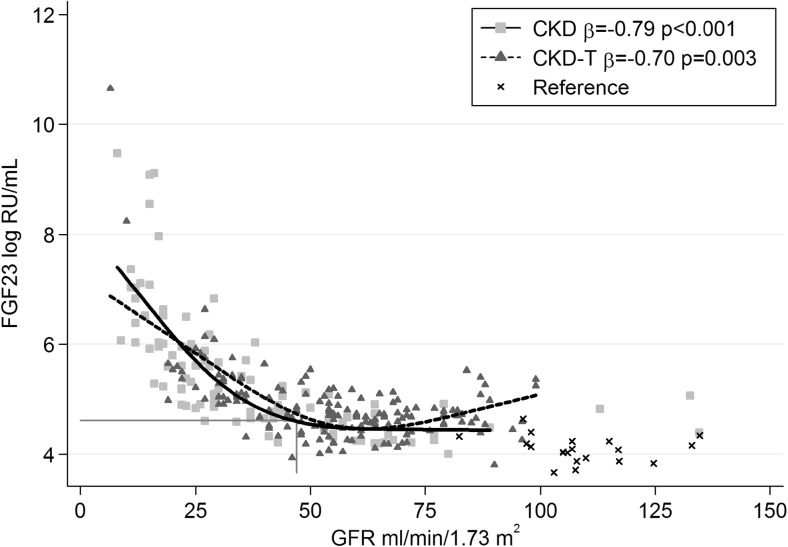
Fig. 2.
Linear regression analysis for longitudinal correlations between log fibroblast growth factor 23 (FGF23) and glomerular filtration rate (GFR) using generalized estimating equations (GEE) with an independence covariance matrix. Data are presented graphically using cubic splines with 3 knots due to the non-linear relationship between FGF23 and GFR. Vertical line GFR level at which the mean FGF23 is above the upper reference limit (101 RU/mL = 4.62 log RU/mL) for the CKD patients

