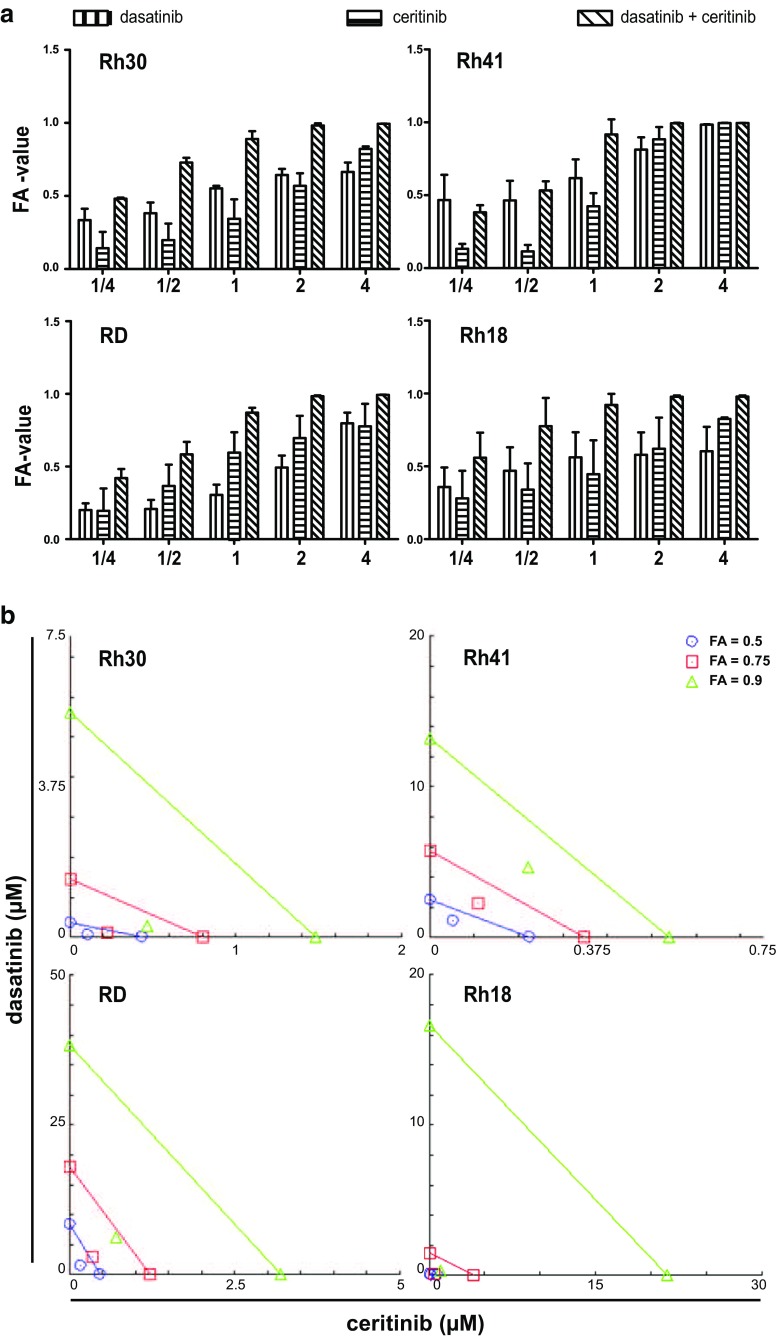
Fig. 7.
Evaluation of synergism for dasatinib and ceritinib combination treatment in ARMS and ERMS cell lines. a ARMS (Rh41, Rh30) and ERMS (RD, Rh18) cell lines were treated with a range of dasatinib and ceritinib concentrations (1/4× IC50 – 4× IC50) either as mono- or combined therapy and the fraction of the cell viability (FA-value) affected by the treatment was calculated. Bars represent the mean ± SD. X-axis represents the fraction of the IC50-value used for treatment. b Isobolograms show synergistic effects of the combination treatment at a FA-value of 0.5, 0.75 and 0.9 for each cell line. Points on the x-axis (ceritinib) and y-axis (dasatinib) represent monotherapy doses necessary to generate the given FA-value. Line connecting the x- and y-axis represent an additive effect of the combination (CI = 1.0). Points below and above the line represent synergism (CI < 1.0) and antagonism (CI > 1.0), respectively

