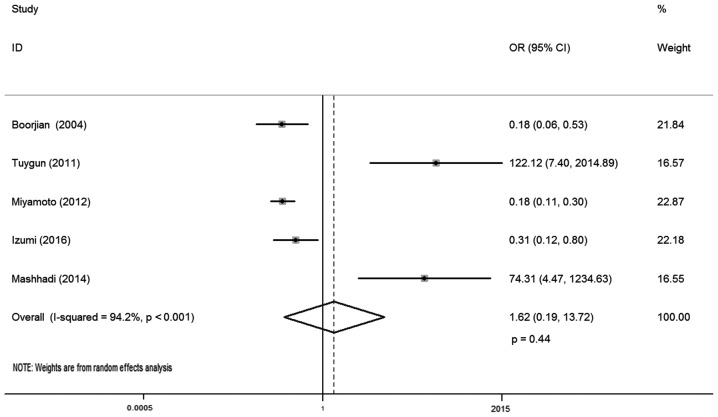
Figure 2.
Forest plot of OR for bladder cancer susceptibility. Square indicates point estimate of each study. Size of square indicates relative contribution of each study. Solid horizontal line represents 95% CI of each study. The diamond indicates the pooled OR value. OR, odds ratio; CI, confidence interval.

