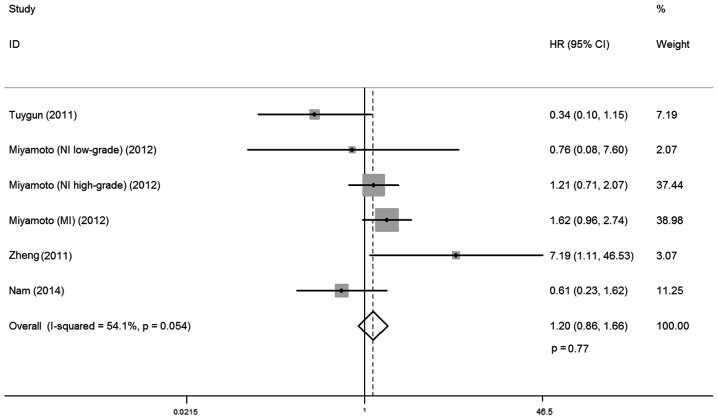
Figure 6.
Forest plot of HR for progression-free survival. Square indicates point estimate of each study. Size of square indicates relative contribution of each study. The horizontal line crossing the square represents the 95% CI. The diamond indicates the pooled HR value. NI, non-invasive; MI, muscle invasive; HR, hazard ratio; CI, confidence interval.

