Figure 2.

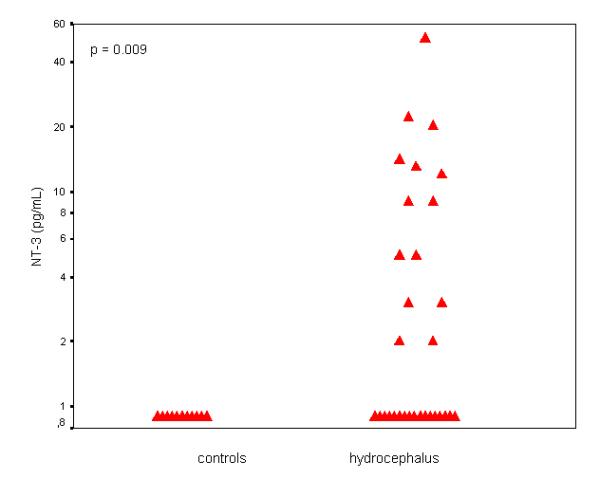
NT-3 concentrations (logarithmic scale) in CSF samples of infants and children with hydrocephalus (right, n = 31) and controls (left, n = 11).

NT-3 concentrations (logarithmic scale) in CSF samples of infants and children with hydrocephalus (right, n = 31) and controls (left, n = 11).