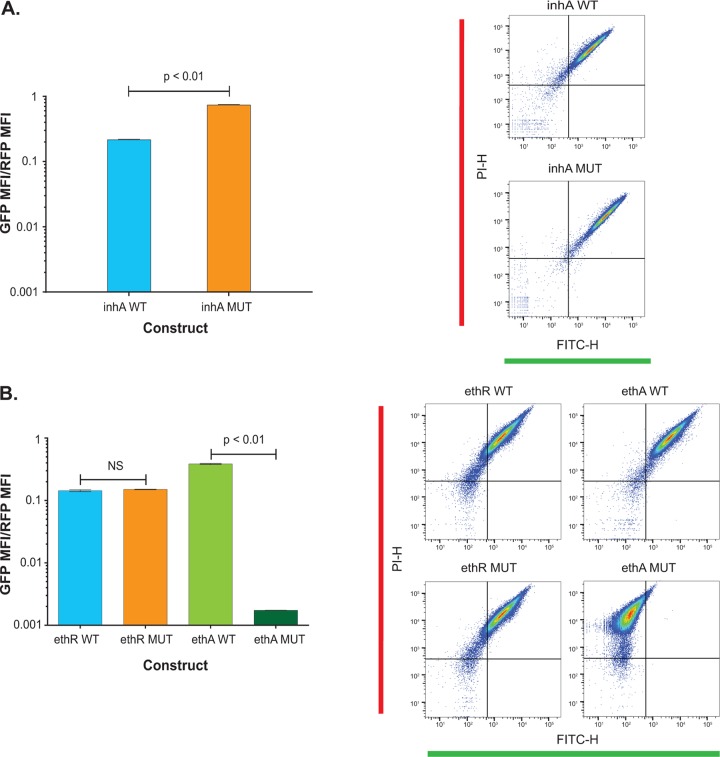
FIG 3.
Analysis of promoter activity between the wild-type (WT) and mutant (MUT) constructs. (Left) Ratios of the median fluorescent intensity (MFI) of the green fluorescent protein (GFP) to the MFI of the red fluorescent protein (RFP), as well as statistical differences between the wild-type and mutant constructs for the inhA promoter (A) and ethA and ethR promoters (B). P values are indicated on the bar charts. (Right) Single cell counts from flow cytometry. RFP expression is represented on the y axis as the PI-H (height) channel, and GFP expression is represented on the x axis as the FITC-H (height) channel.

