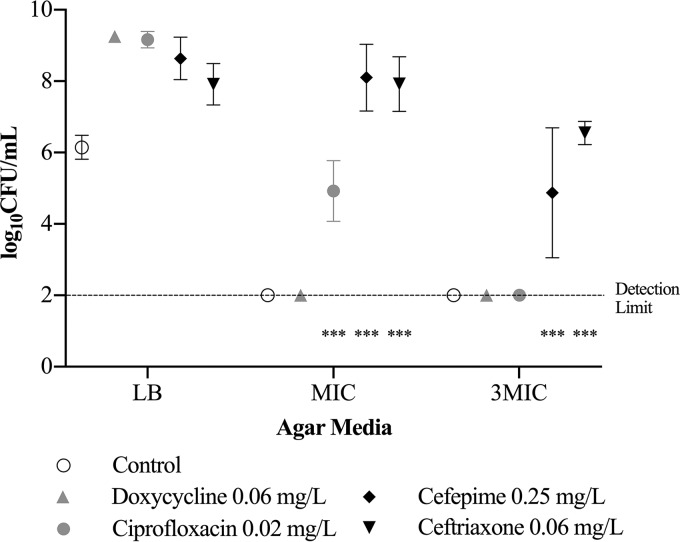
FIG 3.
Antibiotic resistance in V. vulnificus after suspension in antibiotic concentrations with minimal bacterial inhibition for 48 h. Bacterial growth is represented as means ± standard deviations on LB agar and the respective antibiotic agar at the MIC and at three times the MIC (3MIC). Asterisks indicate antibiotic groups that had bacterial growth significantly higher, by 2 log10 units, than the control (***, P < 0.001).

