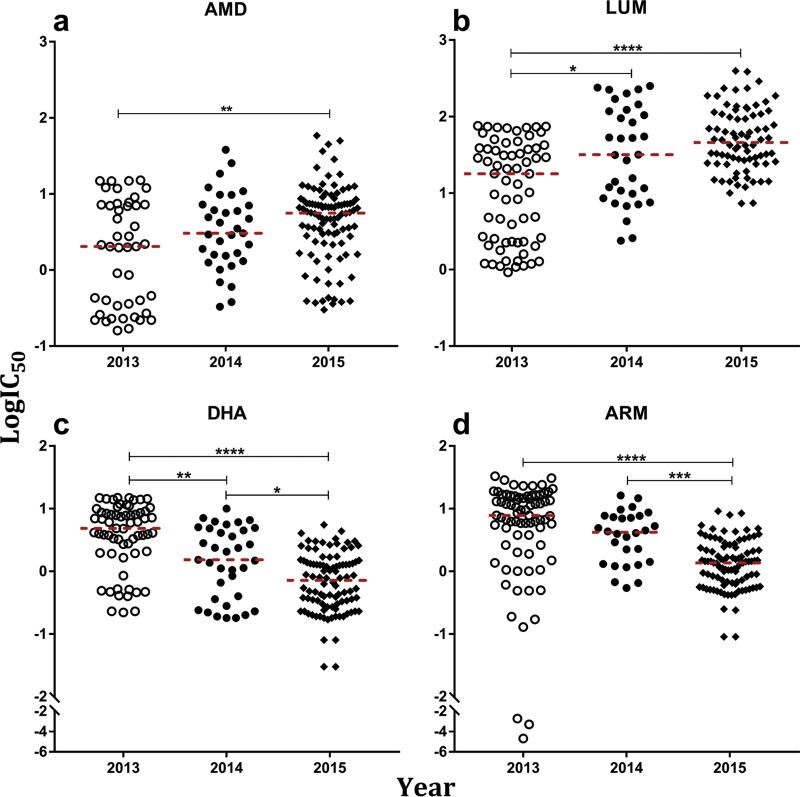
FIG 1.
In vitro drug susceptibilities of Plasmodium falciparum isolates collected from Brikama (western Gambia) during the transmission seasons from years 2013 to 2015. Each plot shows the log10 of the 50% inhibitory concentration (logIC50) of isolates for a drug grouped per year of isolate collection as labeled on the x axes. Each point is the logIC50 for an isolate against amodiaquine (AMD) (a), lumefantrine (LUM) (b), dihydroartemisinin (DHA) (c), and artemether (ARM) (d). The median for each drug per year is shown as broken red lines. Lines connect pairs of years for which the distribution of IC50s were significantly different at a P value of <0.05 (*). The most significant differences had P values of <0.0001 (****).

