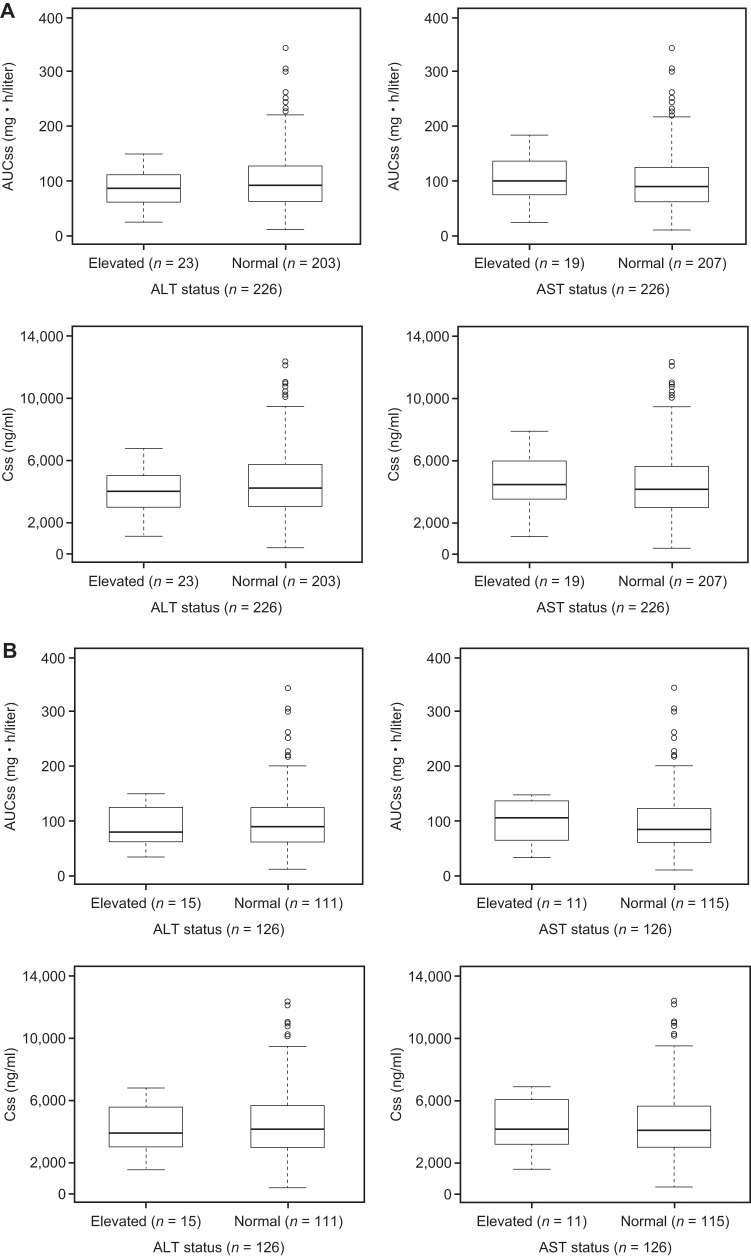
FIG 4.
Box-and-whisker plots of drug exposure (AUCss and Css) versus ALT/AST levels at EOT for the ITT population (A) and the mITT population (B). Boxes represent the median and 25th and 75th percentiles, whiskers represent the range of maximum and minimum values within 1.5× the interquartile range, and outliers are shown as circles.

