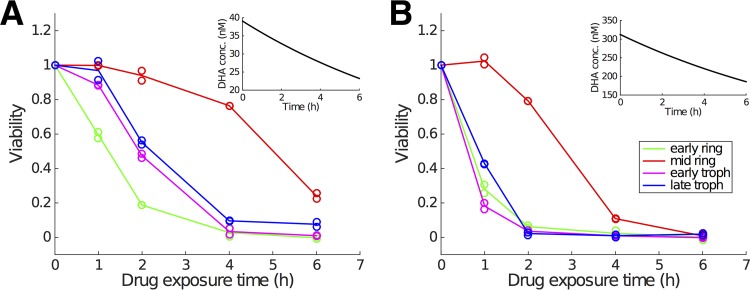
FIG 1.
Representative experimental data showing how the fraction of viable parasite (i.e., viability) changes with the duration of drug exposure for two different initial DHA concentrations (39 nM [left] and 300 nM [right]) and four different parasite life stages. For one parasite stage and one drug exposure time in each panel, duplicate viability measurements are provided, which means in total 40 data points are measured in each panel (note that viability for zero exposure time is always equal to 1 due to normalizing parasitemia to itself). Insets indicate the in vitro decay of DHA concentration. Empty circles display the raw viability data, and the curves pass through the arithmetic means of the paired data points. (Data are sourced from reference 7.)

