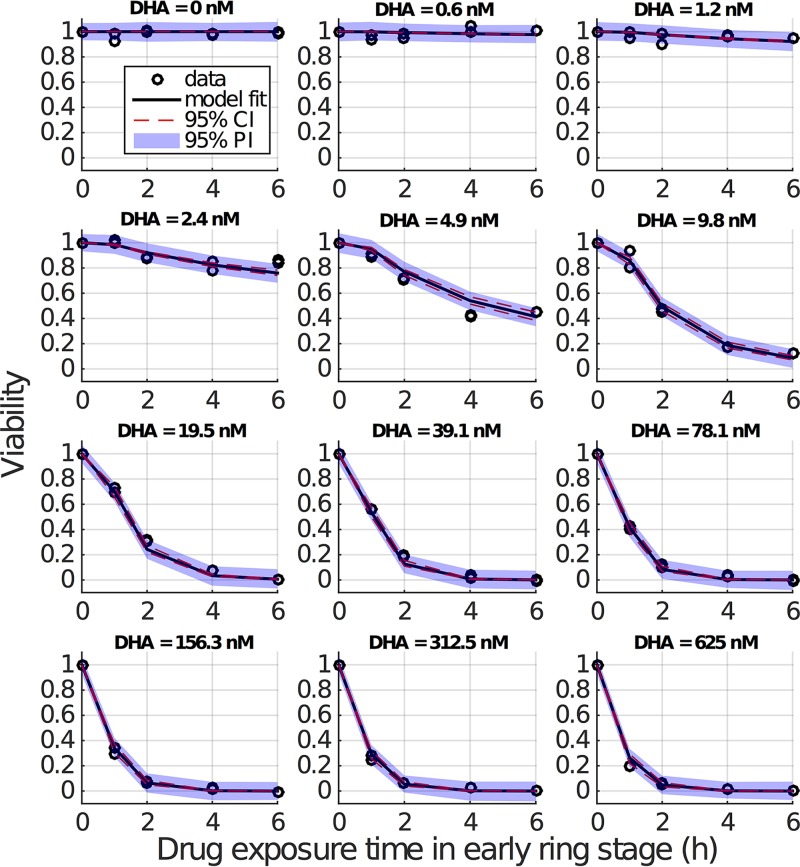
FIG 2.
Results of fitting the model to viability data (early ring stage). The initially applied DHA concentration is indicated for each panel. Empty circles (appearing in duplicate) are the repeated measures of viability by (initial) drug concentration and exposure duration. For one DHA concentration and one drug exposure time in each panel, duplicate viability measurements are provided, which means in total 10 data points are measured in each panel (note that viability for zero exposure time is always equal to 1 due to normalizing parasitemia to itself). Black curves show the predicted mean viability measurements from the model with fixed γ parameter. Red dashed lines are the 95% confidence intervals (CI) for the predicted mean viability measurements (derived using simulation-estimation of 500 concentration-effect profiles and parametric bootstrap CIs), and blue-shaded regions are 95% prediction intervals (PI; derived 2.5th and 97.5th percentiles of 500 simulated concentration-effect profiles) for a new viability measurement if it were generated under the same experimental conditions (i.e., drug concentration and pulse duration).

