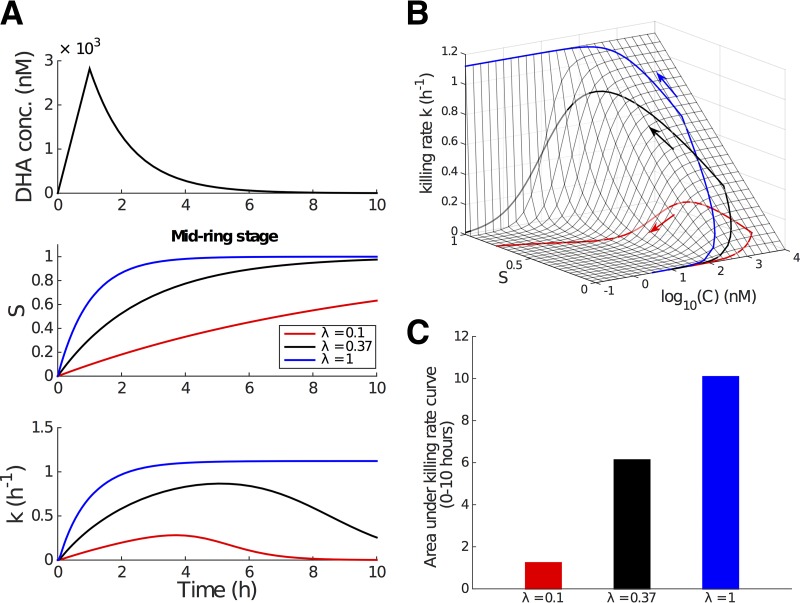
FIG 5.
Incorporation of the time-dependent killing rate into the PK-PD model. We study the mid-ring stage for illustrative purposes. Parameter values are taken from Table 1. (A) Simulated in vivo DHA concentration profile (upper; the in vivo half-life is approximately 0.9 h [2, 21]), the kinetics for the modulatory stress variable, S (middle; black curve, λ = 0.37), and the transient killing rate S (lower; black curve, λ = 0.37) induced by the drug pulse. The middle and lower panels also show how S and k evolve if λ is higher (blue) or lower (red). (B) Killing rate surface as a function of DHA concentration, C, and the stress, S, and the projection of the trajectory of the effective killing rate (i.e., a projection of the curves in panel A [lower]) onto the surface. (C) Area under the killing rate curve, an indication of the total amount of killing achievable over the course of the drug pulse.

