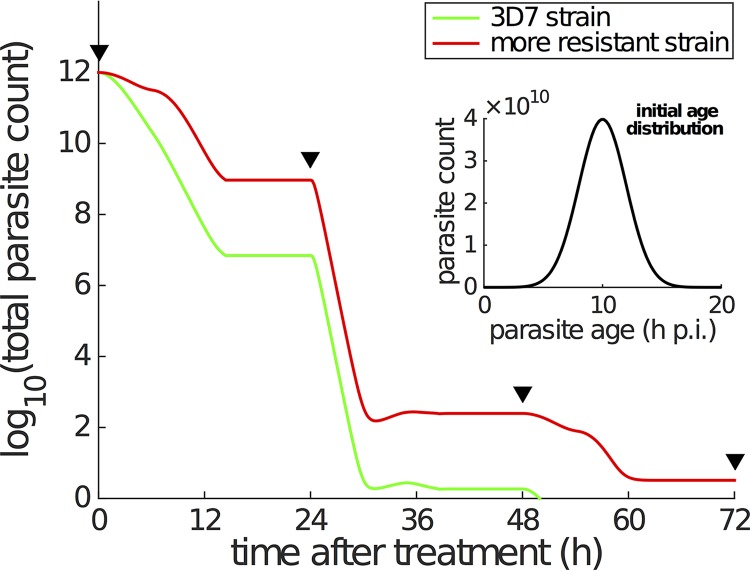
FIG 6.
Simulation of parasite killing under a standard treatment of 2 mg/kg artesunate every 24 h. The inset shows the age distribution of a total of 1012 parasites (per patient) at the start of treatment [∼N(10, 22)]. The parasite multiplication factor is assumed to be 10 (6, 13), which means that 10 new parasites are produced once a parasite reaches 48 h p.i. (i.e., r = 10 in the model). The PK profile is a series of repeated DHA concentration profiles every 24 h (i.e., repeated simulations of DHA concentration profile shown in Fig. 5A, upper). The black triangles indicate when the doses are given. The green curve corresponding to the laboratory 3D7 strain is generated using the parameters in Table 1, while the red curve is generated using the same set of parameters except for reducing λ for mid-ring stage to be 0.1 h−1 to simulate a more resistant strain. With limited information, we simply divide the 48-h life cycle into early ring stage (0 to 6 h p.i.), mid-ring stage (6 to 26 h p.i.), early trophozoite (26 to 34 h p.i.), and late trophozoite (34 to 48 h p.i.) in the simulation. The modulatory variable S is assumed to follow equation 6 only when DHA concentration, C, is ≥0.1 nM (i.e., C* = 0.1 nM), and S is immediately reset to zero when the DHA concentration drops below 0.1 nM.

