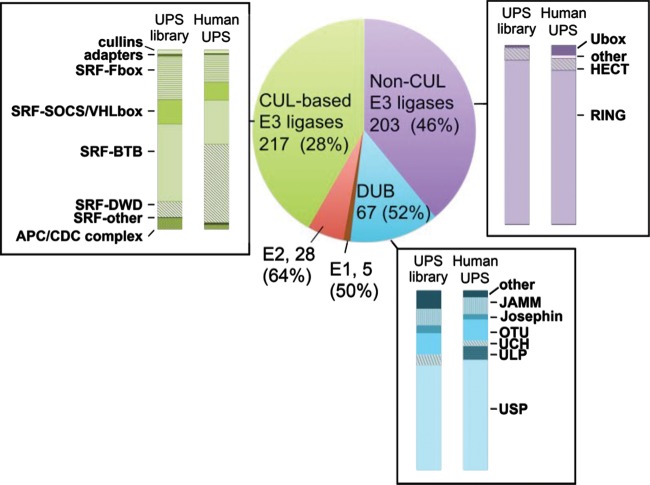
FIG 1 .
Pie chart representation of the UPS library. For each category of the UPS, the number of factors is indicated, as is the coverage of the in silico human UPS database (in parentheses). The representativeness of subcategories for the DUB, cullin-based (CUL-based), and non-cullin-based (Non-CUL) E3 ligases is shown for the human UPS and the UPS library.

