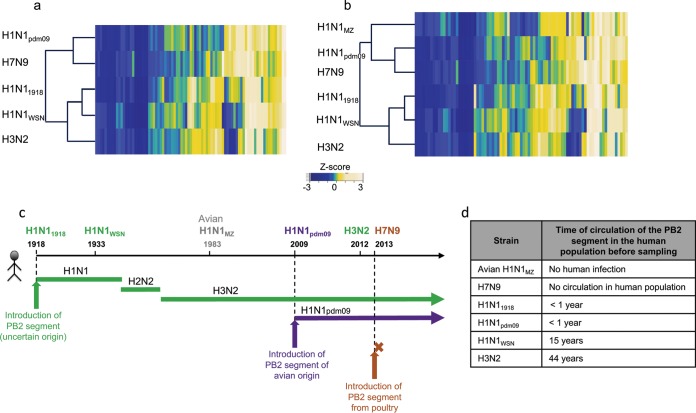
FIG 3 .
Interaction dendrograms deduced from PB2-UPS interaction mapping. (a) Hierarchical clustering of the five PB2 proteins indicated on the basis of their human UPS interaction profiles. Heat maps represent the z scores derived from an experimentally homogeneous set of NLRs obtained by the retesting of 75 UPS factors at once in the NLR retesting-2 experiment (Table S3). (b) Hierarchical clustering of PB2-UPS interaction profiles including H1N1MZ PB2. (c) Schematics delineating, for the IAV strains used in this study the year of PB2 segment introduction into humans (vertical arrows). The brown arrow indicates the infection of a human patient without any spread in the human population; the course of the PB2 segment in the human population is indicated by plain lines (adapted from reference 41). (d) Time of circulation in the human population of the PB2 segment before strain sampling.

