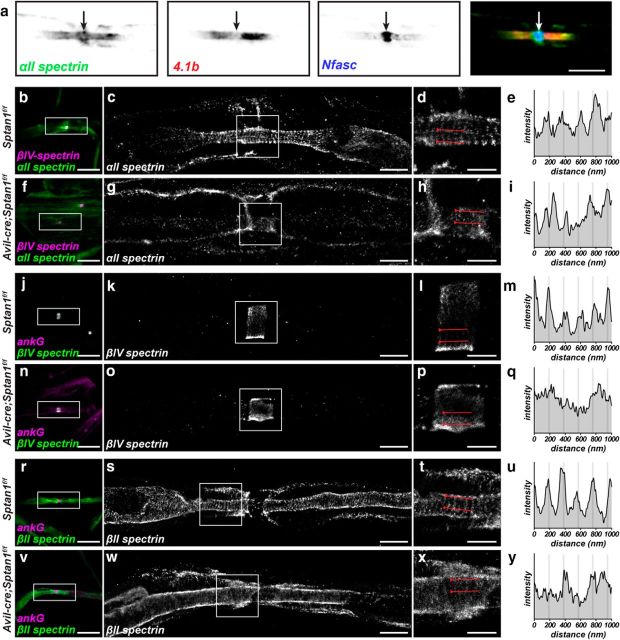
Figure 2.
αII spectrin is enriched at nodes of Ranvier in large-diameter axons. a, Detergent-extracted adult sciatic nerve node of Ranvier labeled for αII spectrin (green), protein 4.1b (red), and Nfasc (blue). Arrow indicates the position of the node. Scale bar, 5 μm. b–y, Teased dorsal root axons from 5-month-old Sptan1f/f and Avil-cre;Sptan1f/f mice. b–i, Conventional immunofluorescence (magenta represents βIV spectrin; green represents αII spectrin; b, f) and STORM imaging (αII spectrin; c, d, g, h) of control Sptan1f/f (b–d) and αII spectrin-deficient Avil-cre; Sptan1f/f (f–h) mouse dorsal roots. c, g, Boxes surround nodes and correspond to the STORM images shown in d and h, respectively. The regions between the lines in d and h were used to generate an αII spectrin intensity profile (e, i). Scale bars: b, f, 10 μm; c, g, 2 μm; d, h, 1 μm. j–q, Conventional immunofluorescence (magenta represents ankG; green represents βIV spectrin; j, n) and STORM imaging (βIV spectrin; k, l, o, p) of control Sptan1f/f (j–l) and αII spectrin-deficient Avil-cre; Sptan1f/f (n–p) mouse dorsal roots. k, o, Boxes surround nodes and correspond to the STORM images shown in l and p, respectively. l, p, The regions between the lines were used to generate a βIV spectrin intensity profile (m, q). Scale bars: j, n, 10 μm; k, o, 2 μm; l, p, 1 μm. r–y, Conventional immunofluorescence (magenta represents ankG; green represents βII spectrin; r, v) and STORM imaging (βII spectrin; s, t, w, x) of control Sptan1f/f (r–t) and αII spectrin-deficient Avil-cre; Sptan1f/f (v–x) mouse dorsal roots. s, w, Boxes are located in paranodal regions and correspond to the STORM images shown in t and x, respectively. t, x, The regions between the lines were used to generate a βII spectrin intensity profile (u, y). Scale bars: r, v, 10 μm; s, w, 2 μm; t, x, 1 μm.

