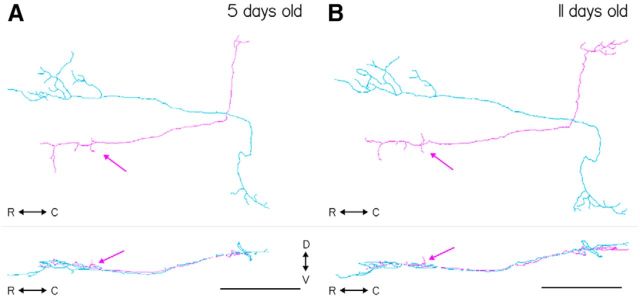
Figure 3.
Tracings of two vestibular nucleus neurons from a single fish at two developmental time points. A, Horizontal (top) and sagittal (bottom) projections of two traced neurons taken from the same fish imaged at 5 dpf. Magenta trace represents the characteristic projection to the nIV motoneuron pool (magenta arrows), whereas the green neuron does not. B, Same two neurons traced in the same fish, at 11 dpf. The same projection to nIV is visible in the magenta tracing (magenta arrow). Scale bars, 100 μm.

