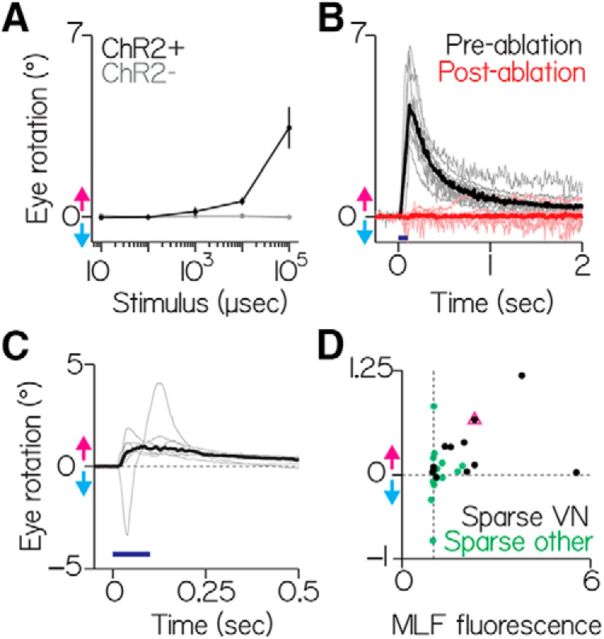
Figure 7.
Activating vestibular nucleus neurons generates downward eye rotations. A, Peak eye rotation as a function of blue light duration. Positive values indicate eyes-down rotations (magenta arrow). Negative values indicate eyes-up (cyan arrow). Black represents ChR2+ fish. Gray represents ChR2− siblings. Points are median ± median absolute deviation. B, Evoked eye rotation in time. Gray lines indicate individual fish. Black lines indicate the median of prelesion data. Red lines indicate the same fish after photoablation of ChR2+ vestibular neurons. Blue represents stimulus (100 ms). C, Gray lines indicate the average responses from individual fish with pan-neuronal expression. Black represents the median across fish. Blue represents stimulus (100 ms). The trace with a downward lobe indicates a nontorsional component; video of this fish is shown as Figures 7-1 and 7-2. D, Evoked ocular rotations from sparsely labeled fish as a function of ChR2+ expression (MLF fluorescence). Black dots represent fish with discriminable vestibular neurons. Green dots represent fish without discriminable vestibular neurons. Pink triangle corresponds to the fish in Figure 2A.

