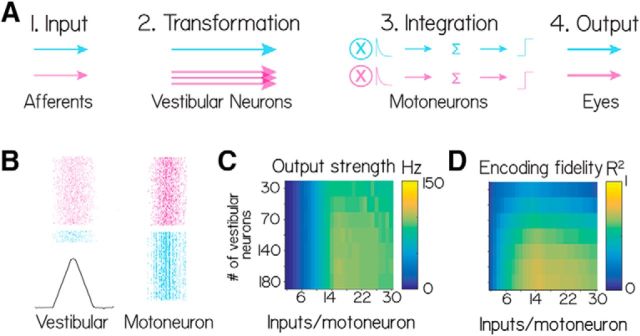
Figure 8.
A, Model schematic. B, One simulation of the model for two different population sizes, 180 neurons (magenta) and 30 neurons (cyan). First column represents the vestibular neuron activity as a spike raster plot and the input function (black). Second column represents the motoneuron spikes. For display, half the generated spikes are shown in each raster. C, The “Output strength” (average firing rate) of the postsynaptic neurons as a function of the population size (rows) and number of inputs per motoneuron (columns). D, The “Encoding fidelity” (variance explained, R) in the input rate function by the summed postsynaptic output.

