
Figure 6.
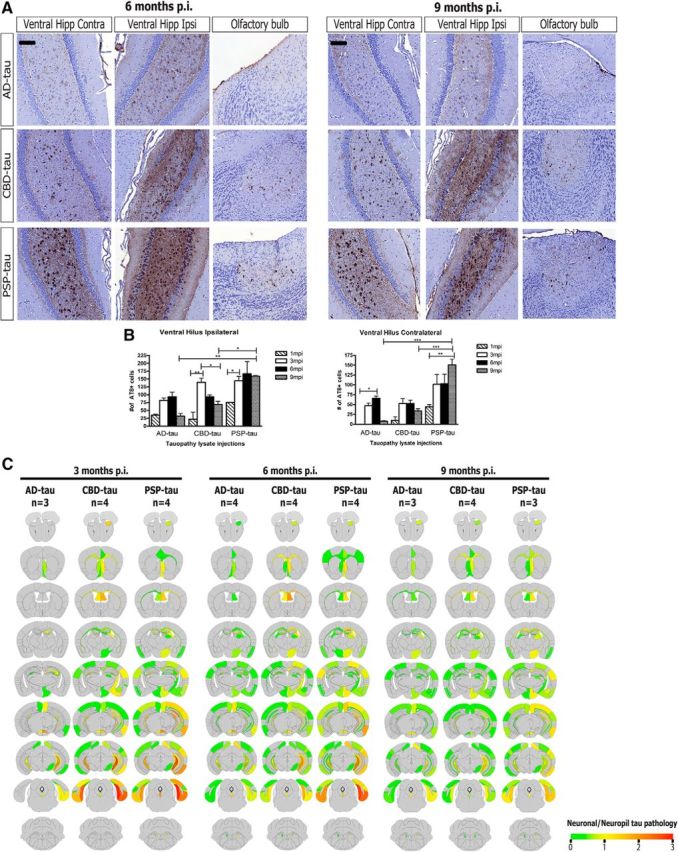
Spatiotemporal transmission patterns of seeded neuronal tau aggregates from three tau strains. A, Left, Representative images from IHC for AT8 for AD-tau- (1 μg/site; n = 4 mice), CBD-tau- (1 μg/site; n = 4 mice), and PSP-tau- (0.7 μg/site; n = 4 mice) injected non-Tg mice 6 months p.i. Right, Representative images from IHC for AT8 for AD-tau- (1 μg/site; n = 3 mice), CBD-tau- (1 μg/site; n = 4 mice), and PSP-tau- (0.7 μg/site; n = 3 mice) injected non-Tg mice 9 months p.i. Scale bar, 100 μm. B, Quantification of AT8+ neurons in ventral hilus region (ipsilateral and contralateral to site of injection) of AD (n = 3 mice for 6 and 9 months), CBD (n = 4 mice for 6 and 9 months p.i.), and PSP-tau (n = 4 mice for 6 months p.i. and n = 3 mice for 9 months p.i.). One-way ANOVA with Bonferroni post hoc test was performed to compare groups (Mean ± SEM plotted; ventral hilus ipsi: F = 7.077, df = 38, ANOVA, p = 0.0001; ventral hilus contra: F = 7.393, df = 38, ANOVA, p = 0.0001; Bonferroni post hoc: *p < 0.05, **p < 0.01, ***p < 0.001). C, Semiquantitative analyses performed on a scale of 0 (gray) to 3 (red) for neuronal tau pathology and color coded onto heat maps. Scores were averaged between mice for each group at 3 months p.i. (n = 3 for AD-tau, n = 4 for CBD-tau, n = 4 for PSP-tau), 6 months p.i. (n = 4 for AD-tau, n = 4 for CBD-tau, n = 4 for PSP-tau), and 9 months p.i. (n = 3 for AD-tau, n = 4 for CBD-tau, n = 3 for PSP-tau). Hipp, Hippocampus; Ctx, cortex; Ipsi, ipsilateral; Contra, contralateral.