
Figure 8.
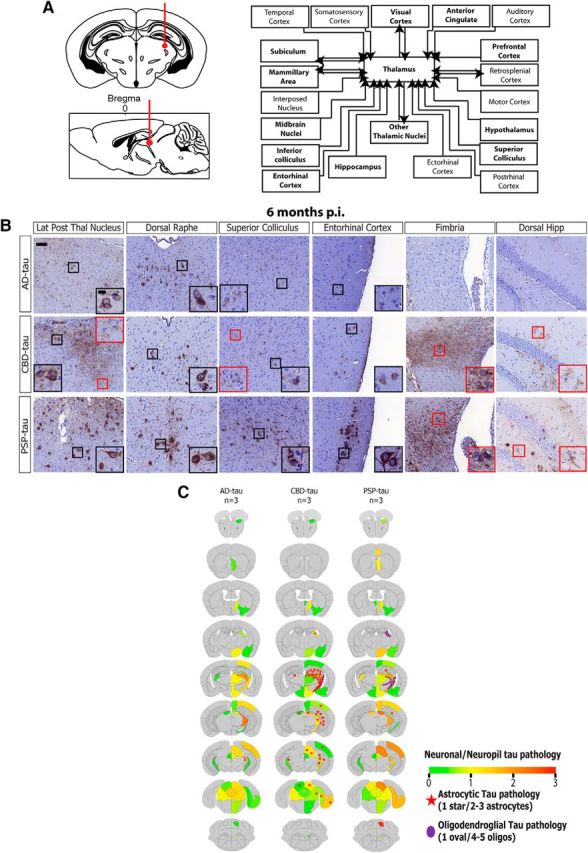
Spatiotemporal transmission of tau pathology from additional injection site in non-Tg mice. A, Left, Schematic coronal and sagittal sections of the mouse brain showing dorsal thalamus injection site (bregma based coordinates: −2.5 mm; lateral: +2 mm; depth: −3.4 mm from the skull). Right, Anatomical neuronal connectome showing anterograde and retrograde connections from the dorsal thalamus. Brain regions with seeded tau pathology are bolded. B, Representative images from IHC for AT8 for AD-tau- (6.4 μg/site; n = 3 mice), CBD-tau- (0.64 μg/site; n = 3 mice), and PSP-tau- (1.1 μg/site; n = 3 mice) injected non-Tg mice 6 months p.i. Scale bars: panel, 50 μm; inset, 10 μm. C, Semiquantitative heat maps were created as described in Figures 4 and 7 on AD-tau-, CBD-tau-, and PSP-tau-injected mice into the thalamus 6 months p.i.