
Figure 4.
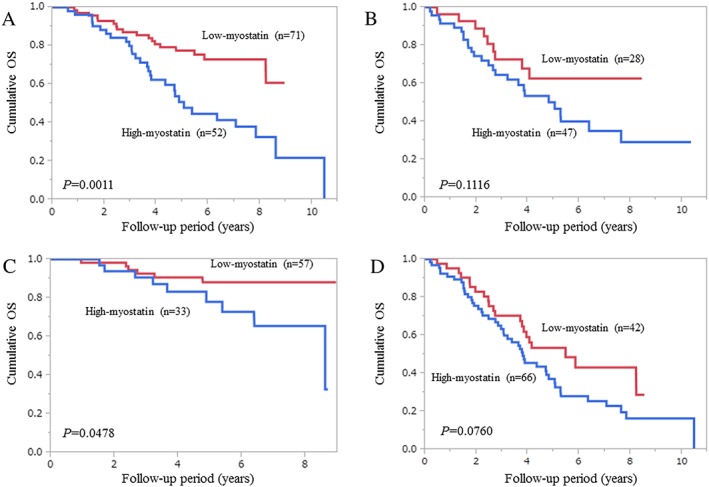
Subgroup analyses with regard to the influence of serum myostatin levels on survival. (A) Child–Pugh A patients (n = 123); (B) Child–Pugh B or C patients (n = 75); (C) patients with a higher psoas muscle index (PMI) (greater than the cut‐off PMI value for each gender (men, 6.36 cm2/m2; women, 3.92 cm2/m2), n = 90); and (D) patients with a lower PMI (less than the cut‐off PMI value for each gender, n = 108).