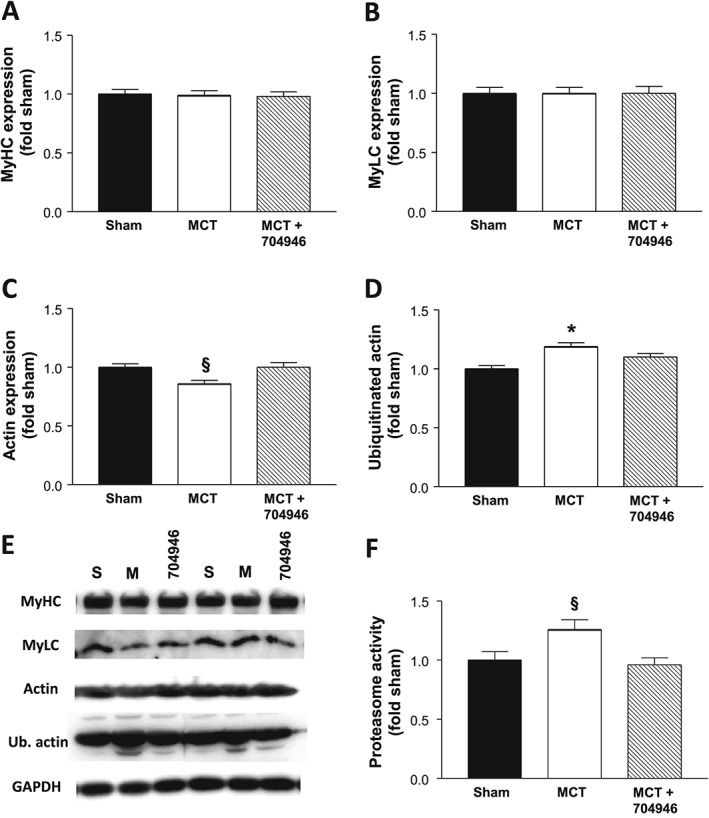
Figure 8.

Protein expression for the contractile proteins myosin heavy (A) and light chains (B), sarcomeric actin (C), as well as ubiquitinated actin (D), with the respective representative blots also presented (E) for sham, MCT, and MCT + ID#704946 mice. In addition, proteasome activity was also measured in each group (F). Data are presented as mean ± SEM, with n = 12–16 per group. *P < 0.05 vs. sham and MCT + ID#704946.
