Figure 2.

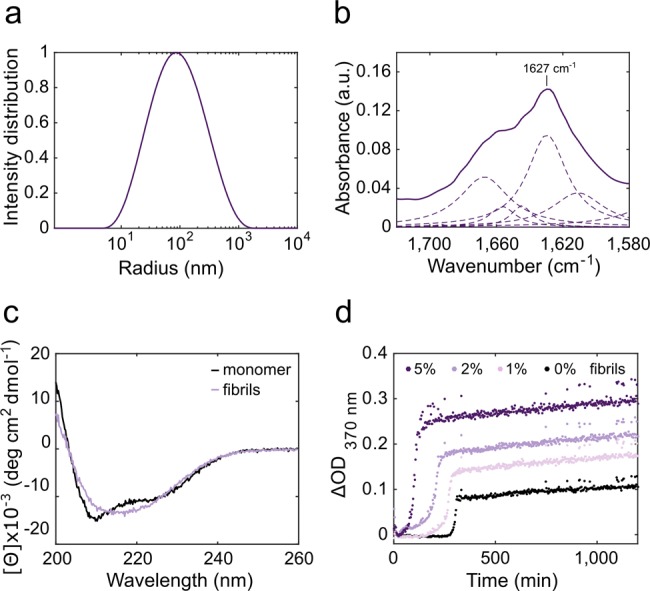
The standard fibril sample was characterized by DLS (a), FTIR spectroscopy (b, shown are the whole spectrum as a solid line and its deconvoluted peaks as dashed lines), far-UV CD spectroscopy (c) and a self-propagation activity assay (d).

The standard fibril sample was characterized by DLS (a), FTIR spectroscopy (b, shown are the whole spectrum as a solid line and its deconvoluted peaks as dashed lines), far-UV CD spectroscopy (c) and a self-propagation activity assay (d).