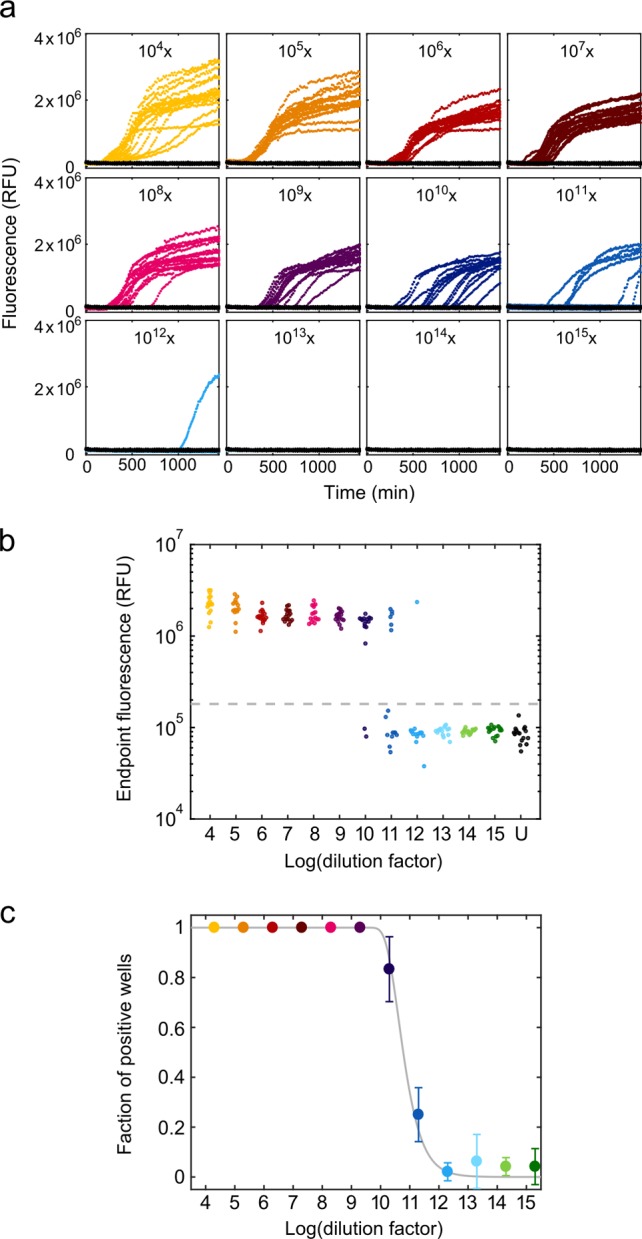
Figure 5.

Assay for 384-well microplate. (a) Real-time ThT fluorescence time courses of insulin fibril formation with 10-fold serial dilutions from 104 to 1015 of the standard fibril sample on a microplate (colored; unseeded controls in black). Each dilution and the control was performed in 16 technical replica. (b) Fluorescence end point signals at different fibril dilution factors (colored; unseeded controls in black, U). The gray dashed line shows the threshold (x̅0 + 5σ0) used for the positive/negative scoring of the signals. (c) Fraction of positive wells as a function of the logarithm of the dilution factor. Data represent the mean ± SD from three independent experiments.
