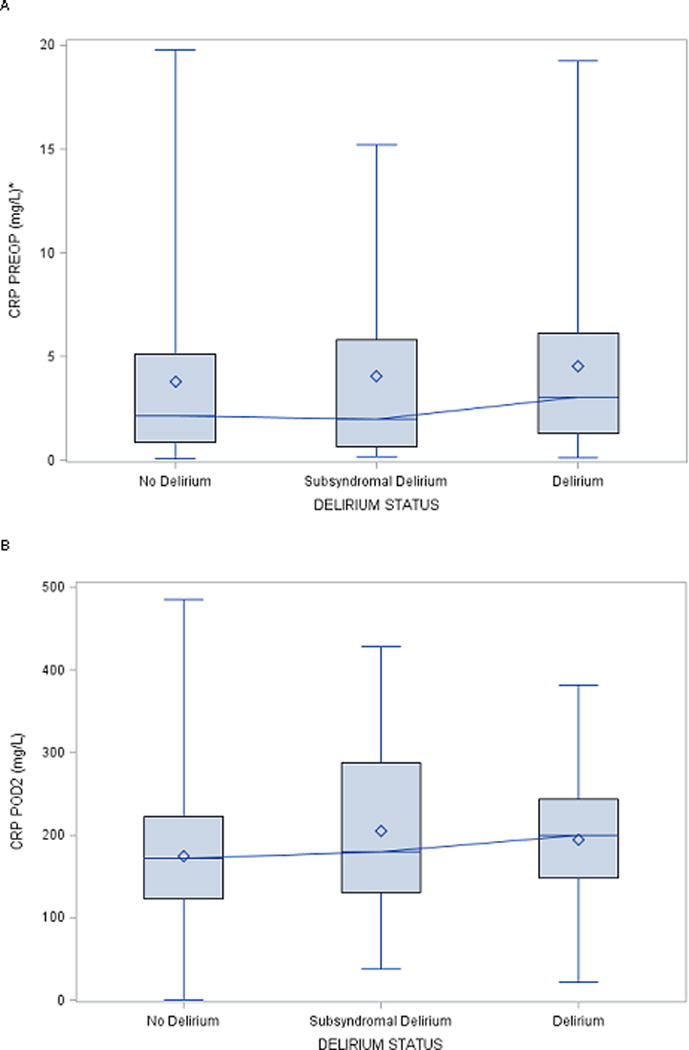
Figure 2. Median levels of C-reactive protein by delirium status at (A) PREOP and (B) POD2.

Abbreviations: CRP=C-reactive protein, PREOP=preoperative, POD2=postoperative day 2
*For graphical readability, PREOP CRP values >20 mg/L were not plotted.
Height of the box represents the interquartile range (the distance between the 25th and 75th percentiles).
The diamond symbol in the box interior represents the group mean.
The horizontal line in the box interior represents the group median.
The vertical lines (“whiskers”) extending from the box indicate the group minimum and maximum values.
