
Figure 1.
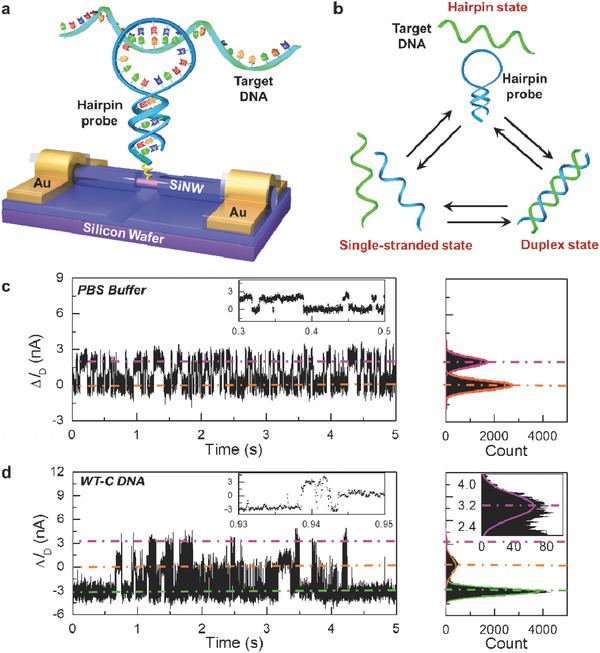
a) Schematic diagram of single‐molecule biosensors, where the interaction between the hairpin probe and the target DNA represents their hybridization process, not implying the conformation of the target binding to the hairpin loop. b) Schematic demonstration of three‐phase transitions during hairpin DNA hybridization with the complementary target. c,d) 5 s interval source–drain current fluctuations ΔI D(t) of a representative single hairpin DNA‐decorated SiNW biosensor measured in a pure PBS solution and a PBS solution containing 1 × 10⁻⁶ m complementary target (WT‐C DNA) at T = 45 °C, respectively. Insets show representative data over a short time interval. The right panels are the corresponding histograms of current values, revealing c) two and d) three Gaussian peaks in conductance.