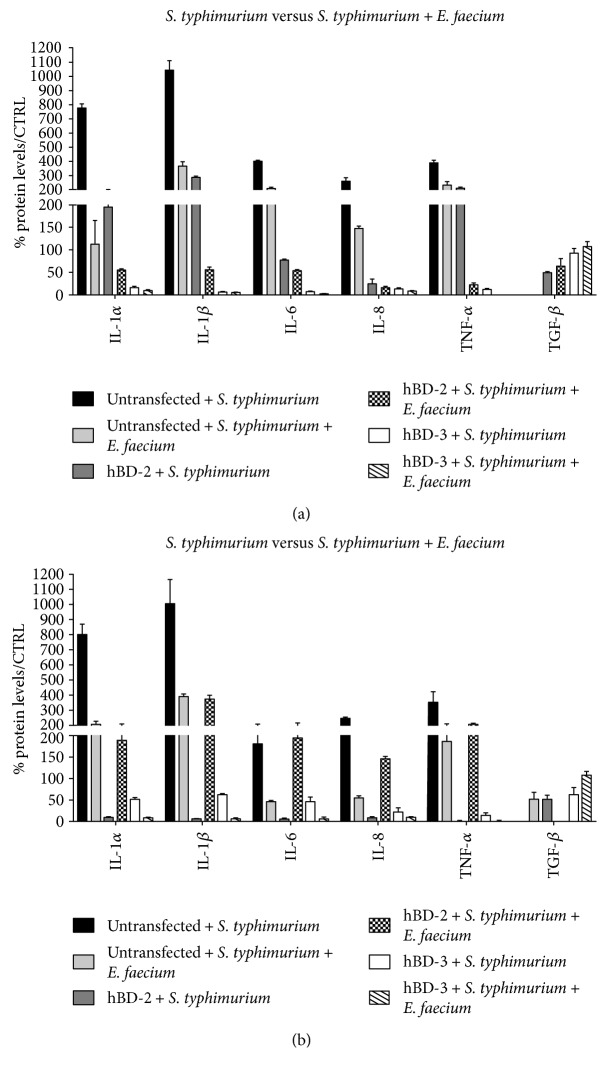
Figure 3.
Comparison between relative gene expression (a) and protein concentration (b) in Caco-2 cells infected with S. typhimurium alone and Caco-2 cells coinfected with S. typhimurium and E. faecium. Data are mean ± SD and are expressed as the percentage of increment compared to uninfected controls.

