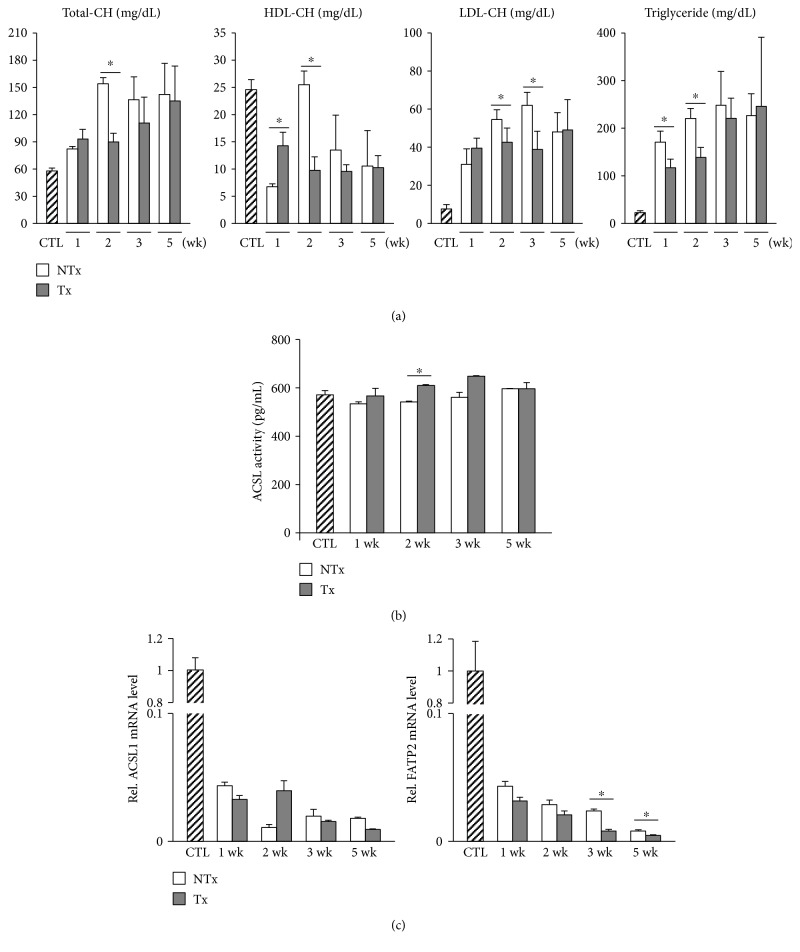
Figure 2.
Changes in serum lipid profiles and expression levels of genes associated with intracellular uptake of fatty acids after BDL and/or CP-MSC transplantation. (a) Serum levels of total cholesterol, HDL cholesterol, LDL cholesterol, and triglyceride. (b) Activities of ACSL, as measured by ELISA. (c) mRNA expression levels of ACSL1 (left) and FATP2 (right). β-Actin was used as an internal control for normalization. Data are expressed as a fold change related to the control group. ∗P < 0.05 (compared to the nontransplanted group). CTL: control group; NTx: nontransplanted group; Tx: transplanted group.

