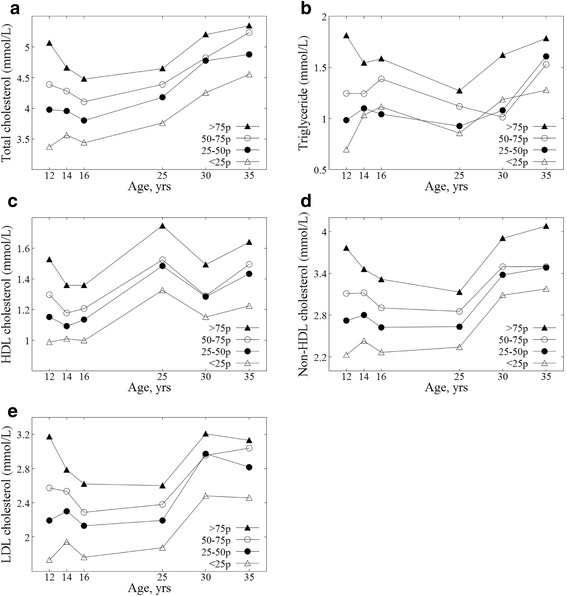
Fig. 1.

Tracking patterns of lipid levels for study participants from adolescence to adulthood. a Total cholesterol. b Triglycerides. c HDL cholesterol. d Non-HDL cholesterol. e LDL cholesterol. Each point in the figures represents the mean value of lipid levels in the baseline quartile group (at 12 years of age, n = 342) at each measurement: at 14 years of age, n = 335; at 16 years of age, n = 313; at 25 years of age, n = 222; at 30 years of age, n = 199; at 35 years of age, n = 186 for total cholesterol. (The number of participants at each measurement for LDL cholesterol was somewhat different due to missing values)
