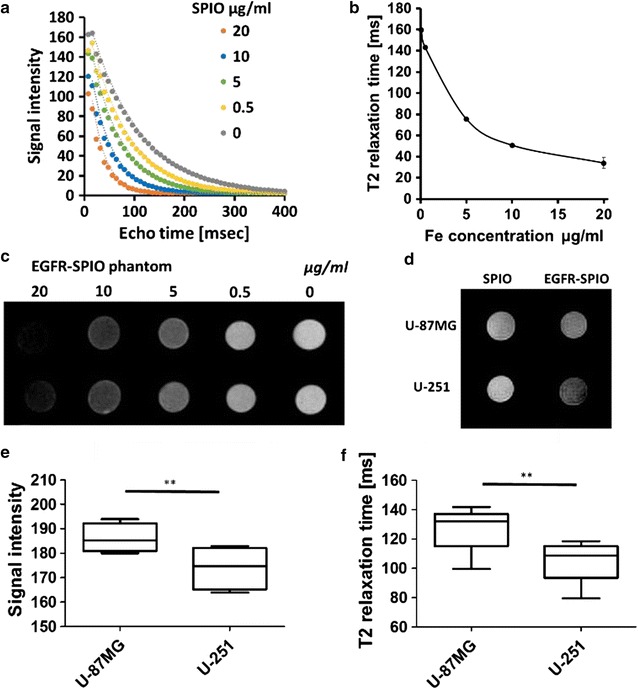
Fig. 7.

Detection of EGFR-SPIO nanoparticle binding in U-87MG and U-251 cells in vitro. a Echo time curve fitting of EGFR-SPIO nanoparticle phantoms in various known concentrations was measured using 7T MRI. b T2 relaxation time of EGFR-SPIO nanoparticles in known Fe concentrations (n = 3 for each concentration). c Corresponding signal intensity images of EGFR-SPIO standards measured using T2-weighted MR. Darkest to brightest, 20, 10, 5, 0.5, and 0 μg/ml. d T2-weighted in vitro images of EGFR-SPIO nanoparticle-treated U-87MG and U-251 cells. Cells were incubated with EGFR-SPIO nanoparticles at 0.1 mg/ml at 37 °C for 2 h. A reduction in T2 signal intensity was observed in EGFRhigh U-251 cells compared with EGFRlow U-87MG cells. e Signal intensity of EGFR-SPIO nanoparticle-treated U-87MG and U-251 cells in box plot. f T2 relaxation time of EGFR-SPIO nanoparticle-treated U-87MG and U-251 cells in box plot
