
Fig. 2.
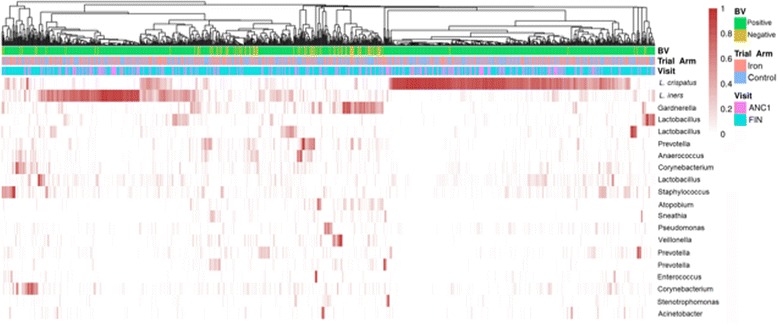
Heatmap showing distribution of the 20 most abundant taxa across all samples with coloured bars showing trial arm, study visit and BV infection
Official websites use .gov
A
.gov website belongs to an official
government organization in the United States.
Secure .gov websites use HTTPS
A lock (
) or https:// means you've safely
connected to the .gov website. Share sensitive
information only on official, secure websites.
Heatmap showing distribution of the 20 most abundant taxa across all samples with coloured bars showing trial arm, study visit and BV infection