Figure 7.

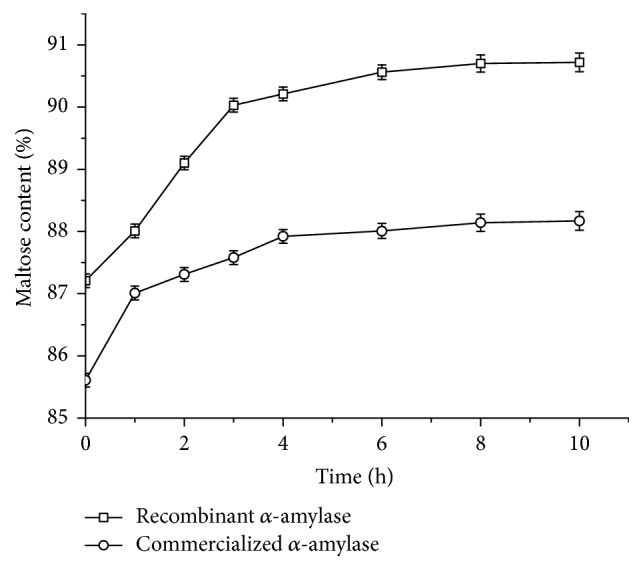
Time profiles of the maltose production reactions performed using recombinant AmyMH and a commercial α-amylase. The data represent the average of three independent measurements. The error bars represent the standard deviation.

Time profiles of the maltose production reactions performed using recombinant AmyMH and a commercial α-amylase. The data represent the average of three independent measurements. The error bars represent the standard deviation.