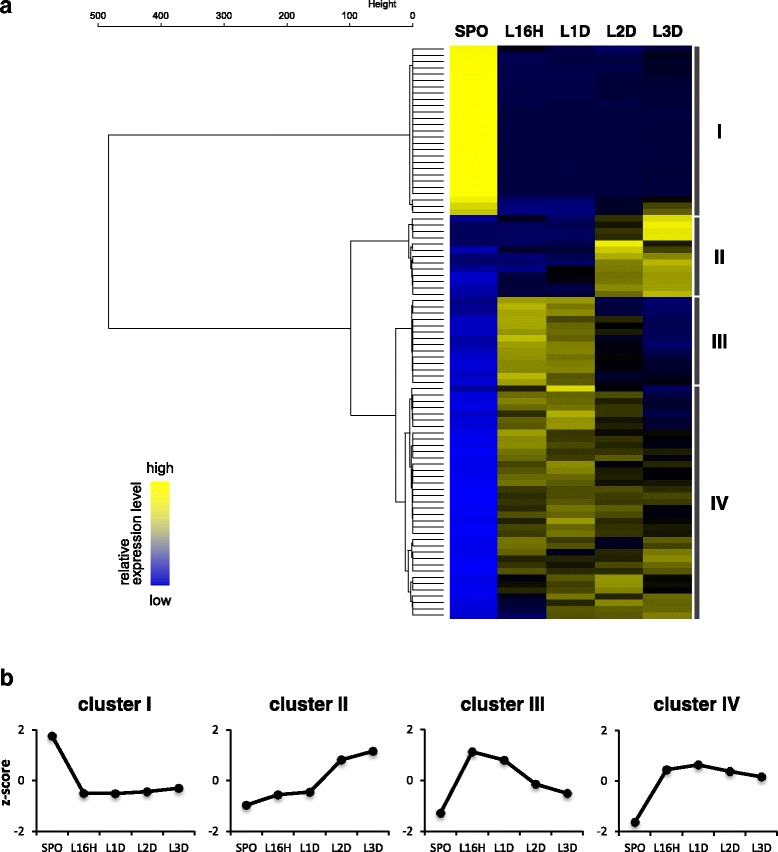
Fig. 3.

Transcriptome profile of Sclerospora graminicola infection. a Heat map showing the expression patterns of DEGs encoding putative secreted proteins. b Line plots of the expression patterns of each gene cluster. SPO: mixture of sporangia and zoospores; L16H: SPO-inoculated leaves 16 h after inoculation; L1D, L2D, and L3D: SPO-inoculated leaves at one, two, and three days after inoculation, respectively
