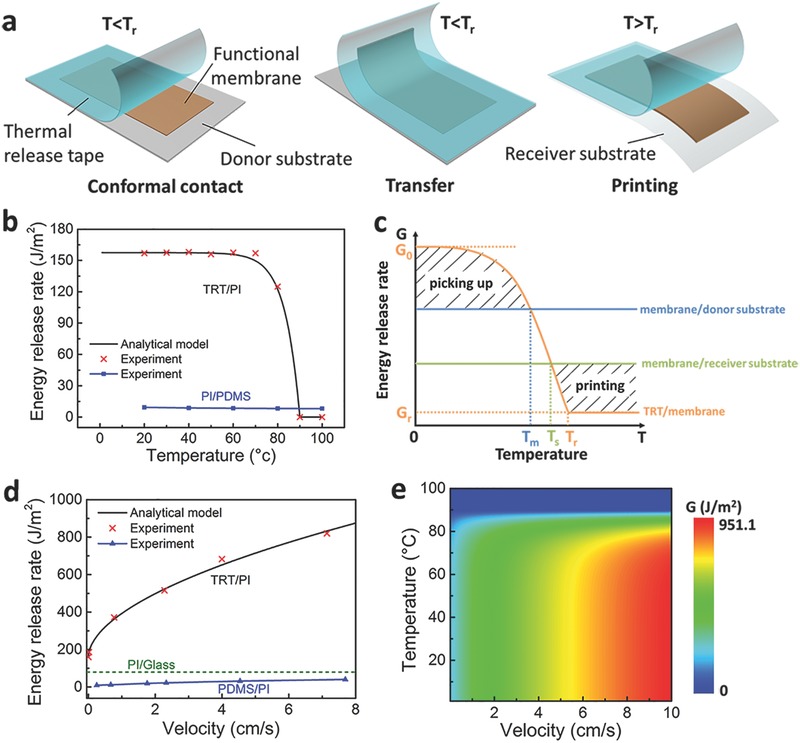
Figure 1.

The mechanism of thermal release transfer printing process. a) Schematic illustration of thermal release transfer printing method. b) Experimental data and theoretical analysis' results of the relationship between the temperature and energy release rate of TRT/PI and PI/PDMS interface. c) Schematic diagram showing the change of TRTs' energy release rate by controlling temperature. d) Experimental data and theoretical analysis' results of the relationship between the velocity and the energy release rate of TRT/PI and PDMS/PI interface. The dotted line represents the energy release rate of PI/Glass interface. e) The contour map showing the relationship between velocity, temperature and energy release rate of TRT/PI interface.
