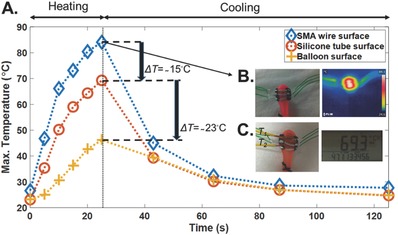
Figure 7.

The Type 3 device with 9 mm SMA wires on the balloon. A) Plot of the maximum temperature versus time for the SMA wire surface (taken by the thermal camera), silicone tube surface, and the balloon surface (measured by the two‐channel thermometer). B) The optical and thermal images at 25 s after applying a voltage of 5 V. C) The connected thermocouples on the SMA wire and balloon surface, and the measured temperatures of channels (T 1 and T 2) at 25 s after applying a voltage of 5 V.
