
Figure 8.
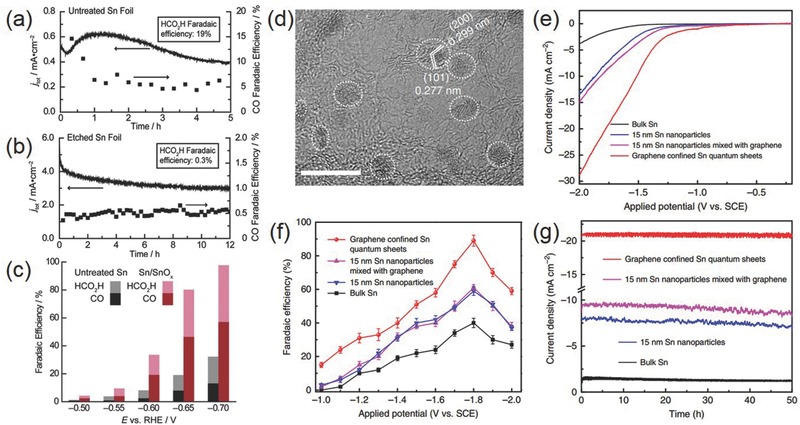
a,b) Change of the total current density and CO Faradaic efficiency with time on a) untreated Sn and b) etched Sn at −0.7 V versus RHE in 0.5 m NaHCO3; c) their potential‐dependent Faradaic efficiency for CO and formic acid. Reproduced with permission.65 Copyright 2012, American Chemistry Society. d) High‐magnification TEM image of Sn quantum sheets confined in graphene; e) polarization curves, f) potential‐dependent Faradaic efficiency for formate, and g) chronoamperometry stability at −1.8 V versus SCE on Sn quantum sheets confined in graphene as well as several control samples in 0.1 m NaHCO3 aqueous solution. Reproduced with permission.79 Copyright 2016, Nature Publishing Group.