Figure 3.

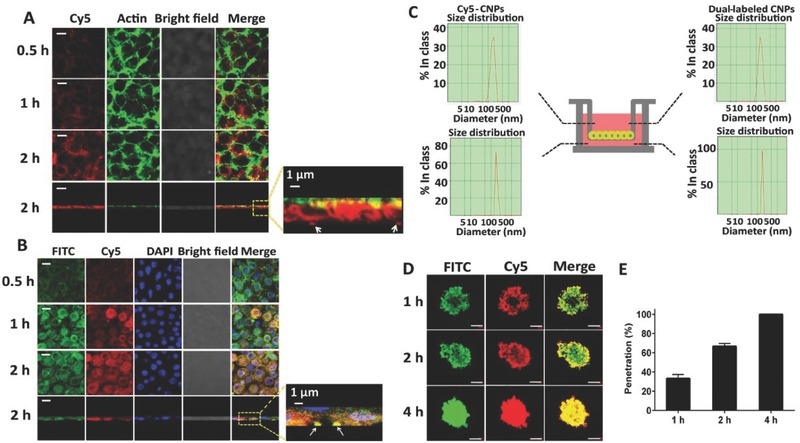
Transcytosis and penetration. A) The colocalization of Cy5‐CNPs (red) with FITC labeled F‐actin (green) in the Caco‐2 cell monolayer after incubation at 37 °C for various durations at a dose of 100 × 10−9 m Cy5‐let‐7a. The image was obtained from the X–Y plane at a depth of 15 µm along the Z‐axis. Yellow or orange spots indicate the colocalization of CNPs with actin. The scale bar is 5 µm. B) The colocalization of dual‐labeled CNPs with Caco‐2 cell monolayer after incubation at 37 °C for various durations at a dose of FITC 10 µg mL−1 or Cy5‐let‐7a 100 × 10−9 m. The nuclei (blue) were stained with DAPI. The depth for CLSM observation was 10 µm along the Z‐axis. The scale bar is 5 µm. Yellow or orange spots demonstrate the integrity of CNPs during the transcytosis process. A/B: The fourth line panels are the X–Z vertical confocal images of the Caco‐2 cell monolayer at 2 h. White arrows indicate the CNPs crossed the Caco‐2 cell monolayer. The scale bar is 5 µm. C) DLS results of CNPs in the apical or the basolateral side under the condition of the Caco‐2 cells monolayer incubated with Cy5‐CNPs or dual‐labeled CNPs at 37 °C for 2 h. D) In vitro penetration of dual‐labeled CNPs into the 3D multicellular 4T1 tumor spheroids after incubation at 37 °C for different times. X–Y–Z images of CLSM were obtained at a depth of 19 µm. The scale bar is 50 µm. E) The penetration percent of CNPs at 4T1 tumor spheroids at 1, 2, and 4 h.
