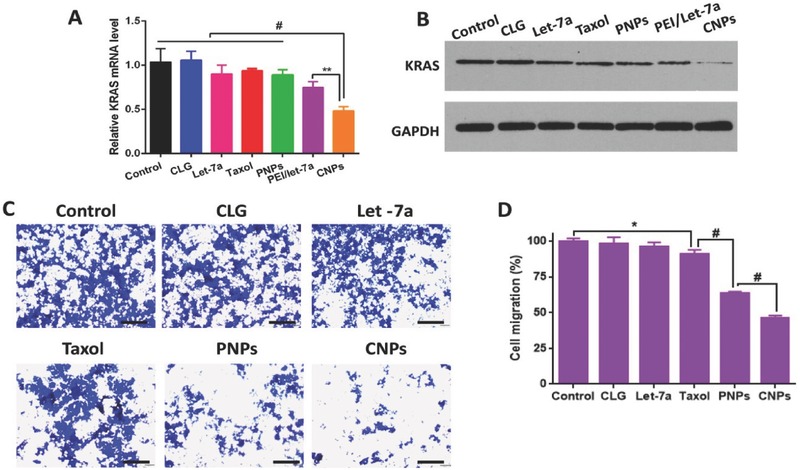
Figure 4.

In vitro transfection and migration inhibition. A) Expression of KRAS detected by real‐time PCR. Cells without treatment represent the control, and the related data were set at 1.0 (n = 3, ** P < 0.01 vs control). B) KRAS expression examined by western blot analysis. GAPDH was utilized as an internal control to normalize protein expression. Cells without treatment served as the control. C) Migration inhibition of 4T1 cells investigated by a transwell chamber assay. Blue spots demonstrate the migrated cells. The control group was the normal cells without treatment. The scale bar is 100 µm. D) Quantitative analysis of cell migration (n = 3, *P < 0.05 and # P < 0.001 vs control).
