
Figure 7.
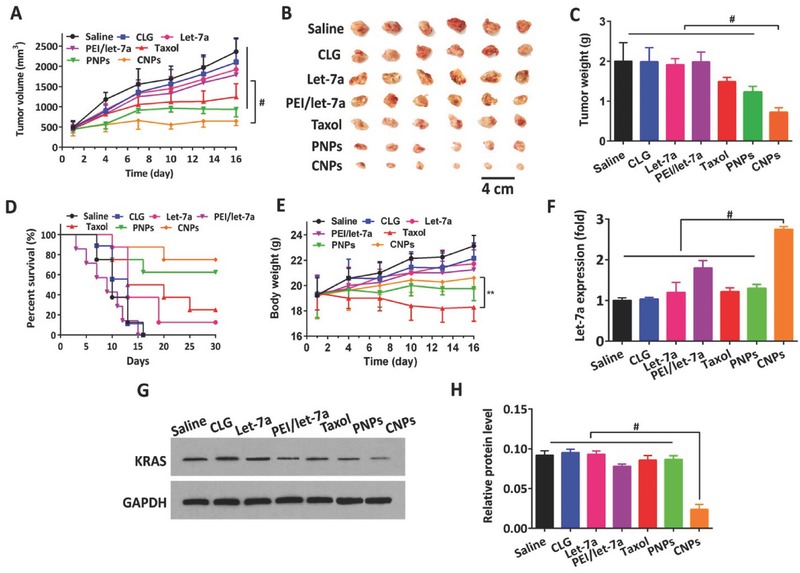
Antitumor activities. Saline, CLG, Taxol, PNPs, and CNPs were administered to 4T1 tumor‐bearing mice via tail vein injections every 3 d at a PTX dose of 10 mg kg−1 and let‐7a dose of 1 mg kg−1, according to the animal's body weight. The injection volume was 0.2 mL. A) Tumor growth curves. B) Image of representative tumors collected from mice at the end of the experiment. C) Tumor weight variation (n = 12, # P < 0.001). D) Survival curves (n = 12, ** P < 0.01, # P < 0.001), and E) body weight change curves. A comparison of the final tumor volume or body weight between groups was performed at day 16. F) Intratumoral delivery of let‐7a examined by real‐time PCR (n = 3, # P < 0.001). G) KRAS expression in tumor from mice detected by western blot analysis. H) Quantitative analysis of KRAS expression in tumors from mice determined by the BCA protein assay (n = 3, # P < 0.001).