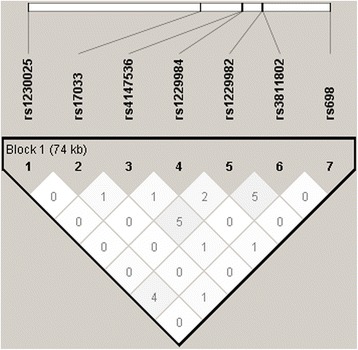
Fig. 3.

Linkage disequilibrium (LD) pattern (r2) of the seven SNPs in ADH1A, ADH1B and ADH1C gene. LD pattern of rs1230025 in ADH1A, rs17033, rs4147536, rs1229984, rs1229982 in ADH1B and rs698 in ADH1C gene in case and control groups. The LD between the SNPs is measured as r2 and shown in the diamond at the intersection of the diagonals from each SNP. r2 = 0 is shown as white, 0 < r2 < 1 is shown in gray and r2 = 1 is shown in black
