
Fig. 3.
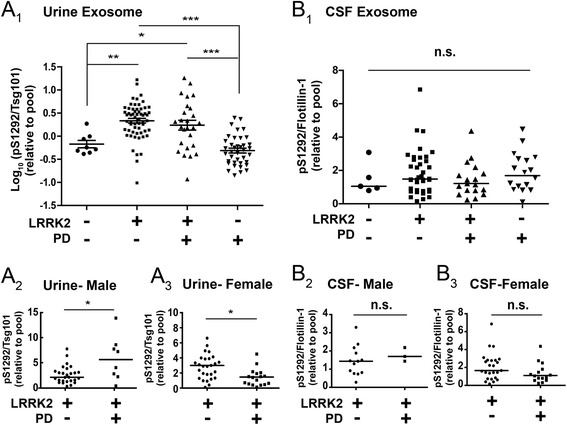
Quantification of exosomal pS1292-LRRK2 in urine and CSF (a) Scatter plots showing pS1292-LRRK2 expression levels normalized to TSG101 expression, relative to the pool (all samples, N=132). Bars depict mean values with error bars showing S.E.M. Quantifications were based on the average value of three independent immunoblot runs. A 2,3 The LRRK2 mutation carrier groups (PD+/-) are broken further according to sex as indicated. Bars show median values. b Scatter plots showing relative pS1292-LRRK2 expression level normalized to flotillin-1 expression, relative to the pool (all samples, N=81). The LRRK2 mutation carrier groups (PD+/-) are broken further according to sex as indicated (B 2,3). Bars show median values. ***p-value<0.001, **p-value<0.01, *p-value<0.05, ns: p-value>0.05. p value between groups were calculated using Tukey’s multiple comparison test (figure a 1 and b 1) and Mann-Whitney test (figure a 2-3 and b 2-3)