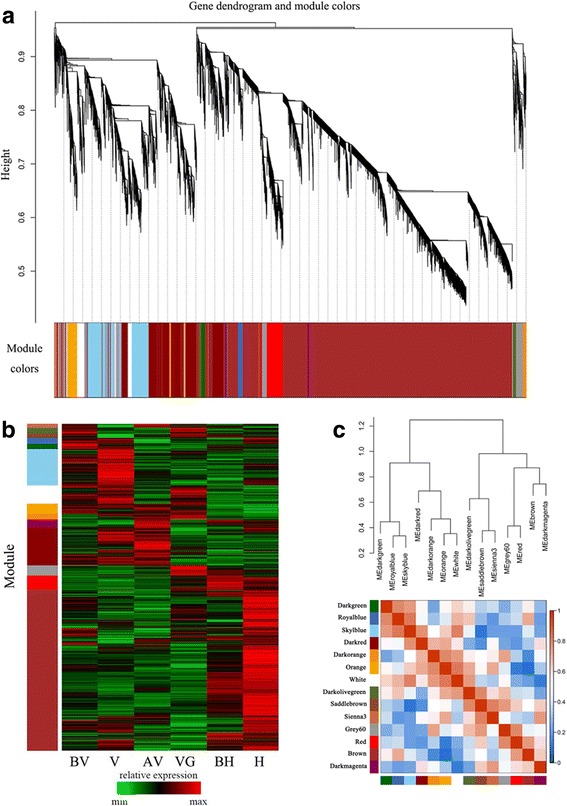
Fig. 4.

WGCNA of genes at six stages. a Hierarchical cluster tree shows coexpression modules, identified via WGCNA. Each leaf in the tree represents one gene. Major tree branches constitute 14 modules labeled by different colors. b This heatmap shows the gene relative expression of different modules in six stages, the y-axis represents the relative expression of modules and the x-axis shows the different stages. c Visualization of the eigengene network represents the relationships among the modules and the clinical trait weight. The hierarchical clustering dendrogram of the eigengenes shows the relationships among the modules. Heatmap shows the correlation of different modules, and the deeper red color represents the higher correlation. Sample labels are as follows: BV, before vernalization; V, vernalization; AV, after vernalization; VG, vegetative growth; BH, before heading; H, heading
