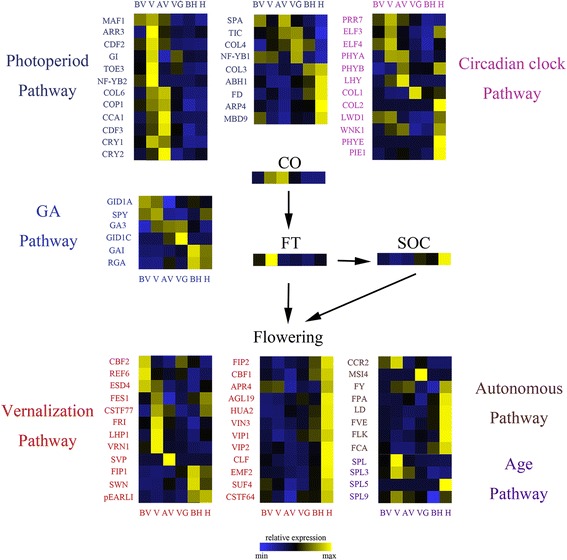
Fig. 6.

Putative schematic network of bolting and flowering regulation in orchardgrass. Arrows indicate positive regulation. The heat map shows the relative expression of candidate genes in different stages, the y-axis represents identified candidate genes, and the x-axis shows the different stages. These identified candidate genes are involved in various flowering pathways according to previous reports. Sample labels are as follows: BV, before vernalization; V, vernalization; AV, after vernalization; VG, vegetative growth; BH, before heading; H, heading
