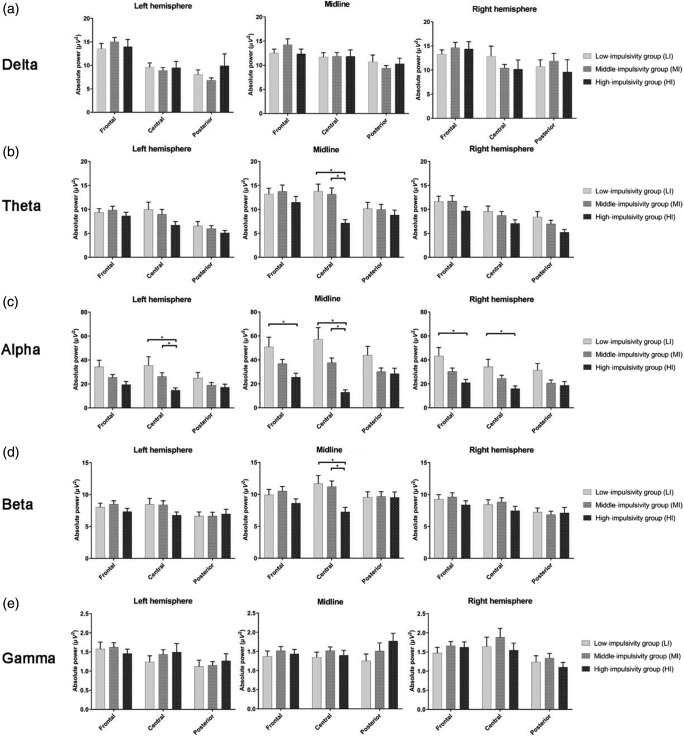
Figure 2.
A Group (LI, MI, and HI) × Region (frontal, central, and posterior) × Hemisphere (left, midline, and right) interaction effects of (a) delta, (b) theta, (c) alpha, (d) beta, and (e) gamma bands. HI group showed decreased theta power in the midline central regions, lower alpha in the left central and midline/right frontocentral regions, and lower beta power in the midline central regions compared with LI or MI groups. The horizontal bars represent standard errors. *Significant difference in the post hoc test with the Bonferroni correction (p < .0167)

