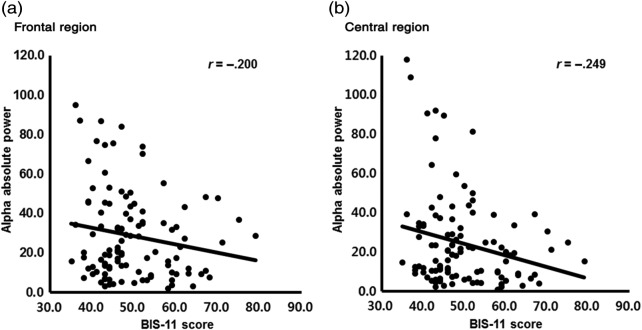
Figure 3.
Statistically significant correlation between averaged alpha band activity and Barratt Impulsiveness Scale-11 (BIS-11) in total group; Significant p value set at .05; (a) correlation between averaged alpha power activity and BIS-11 in the frontal area (r = −.200, p = .037), (b) correlation between averaged alpha power activity and BIS-11 in the central area (r = −.249, p = .009)

